Graph Machine Learning for DFIR with CHRYSALIS

On April 24th, we presented the new version of the ds4n6_lib library (AKA CHRYSALIS) at the RSA23 conference in San Francisco. In this release, we added a new graph Machine Learning (ML) module to analyze DFIR data through graphs. In this post, you will learn how to apply all these new features in your forensic investigations, so grab your data, download ds4n6_lib v0.8, and let's get started!
Graph analysis is gaining popularity in the cybersecurity community. With the rise of sophisticated attacks and more professionalized actors, new investigative techniques are needed. As you can check in our post Graphs for DFIR Analysis. In the Roadmap, cybersecurity teams are using graph techniques to analyze large dataset for detecting threats. The graphs provide a holistic view of the events in a network, being a great tool for detecting Lateral Movement (LM) at scale in large corporate networks.
The new version of CHRYSALIS has come to facilitate all these tasks for analysts. With this new module mlgraph, we can represent our forensic artifacts in a graph and apply advanced Machine Learning models to detect anomalies in the network.
Thinking in Graphs
We can find a lot of success histories about the use of AI models to analyze DFIR data. Examples include works such as Me, My Adversary & AI: Investigating and Hunting with Machine Learning or CHRYSALIS: Age of the AI-Enhanced Threat Hunters & Forensicators. But, What if we interpret our data as graphs? In this case, we would no longer have isolated data, but a series of interconnected events.
For thinking in graphs, the first step will be to represent our data as a graph. CHRYSALIS simplifies this task by providing us with the new function build_lm_dataset(). This function transforms an event logon dataset into a graph by extracting two matrices, the feature and the adjacency matrix. Then, it ties all user sessions using logon events. The function will output a series of user activity sub-graphs from the main graph. Such sub-graphs represent all the lateral movements made by each user in the network in a period. Finally, the function will provide a CSV file with the information of each sub-graph of the network, i.e. a dataset of lateral movements. Using this function is quite simple. Next you can find its main attributes:
| Argument | Default value | Description |
|---|---|---|
| dset | None | Path of the CSV file to read. Event Log Dataset. Min. columns: ['time','event_id','hostname','source_ip','source_hostname','logon_type','remote_user'] |
| mode | 'hostname' | Build mode. 'hostname' to create lateral movement dataset only by using known hostnames. 'ip_addr' to use the IP address for unknown hostnames. |
| path | '/' | Path to store the lateral movement datasets. |
| codify | False | 'True' to replace users and hostnames with nick names. 'False' otherwise. Default 'False' |
Below are a couple of examples of the use of this function.
build_lm_dataset(dset='logons.csv', mode='hostname', path='./')
Output:
| time | user | path |
|---|---|---|
| 2023-01-01 | user001 | [‘host010’, ’host011’, ‘host100’] |
| 2023-01-01 | user005 | [‘host005’, ’host011’] |
| 2023-01-02 | user002 | [‘host001’, ’host011’, ‘host100’, ‘host102’] |
build_lm_dataset(dset='logons.csv', mode='ip_addr', path='./')
Output:
| time | user | path |
|---|---|---|
| 2023-01-01 | user001 | [‘host010’, ’host011’, ‘host100’] |
| 2023-01-01 | user005 | ['1.2.3.4', ‘host005’, ’host011’] |
| 2023-01-02 | user002 | [‘host001’, ’host011’, ‘host100’, ‘host102’] |
Note that with the ‘ip_addr’ mode, the algorithm identifies an additional LM from an unknown hostname with IP address 1.2.3.4 to host005.
Graph Machine Learning
As covered in the Graphs for DFIR Analysis. The Roadmap post, the visualization of lateral movement telemetry with graphs helps in detecting anomalies at scale. However, even by applying these techniques, the investigation can be overwhelming due to the large amount of data we may have in large enterprise networks. Somehow, we need to filter the information to focus on the most suspicious events. Fortunately, Data Science has the solution. AI and ML models can process large datasets and extract high-value information. Specifically, Graph-ML is a sub-field within ML specialized in extracting insights from graph data. CHRYSALIS incorporates these interesting technology in its new version.
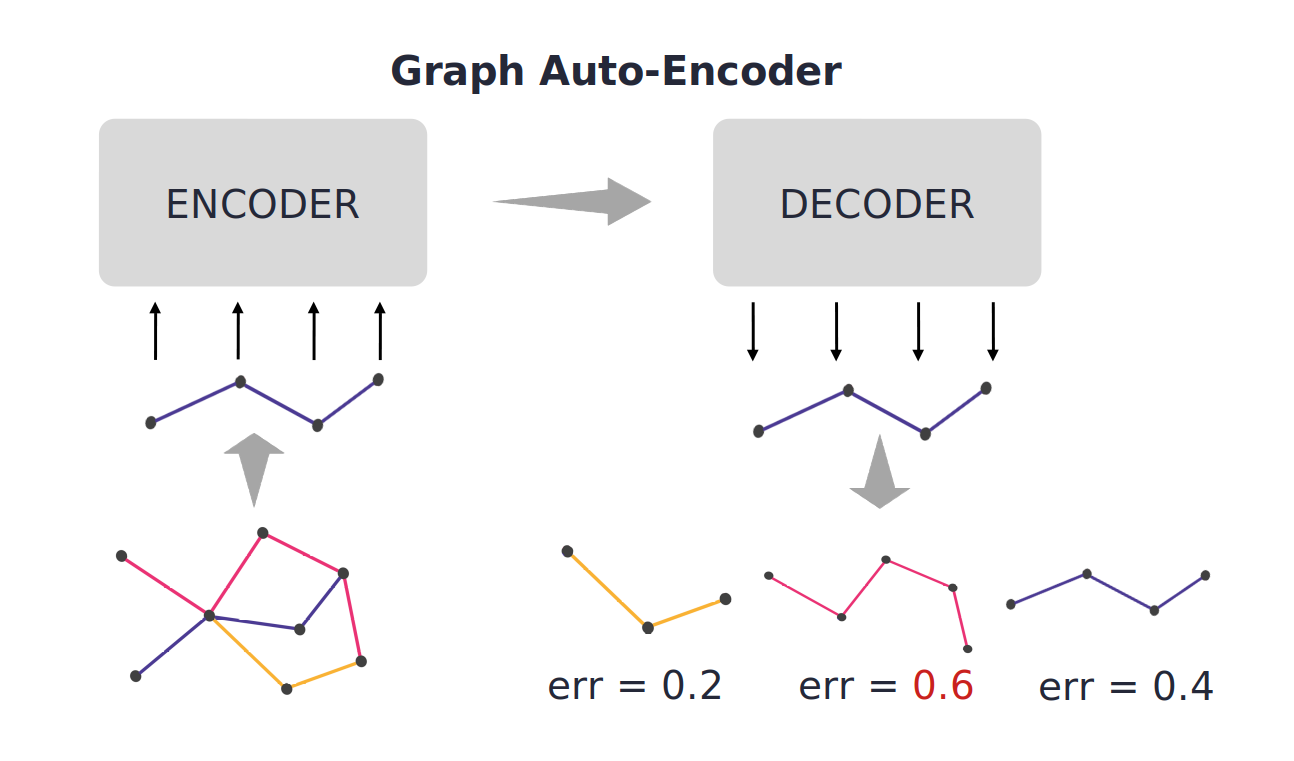
The find_lm_anomalies() CHRYSALIS's function uses the power of Graph ML to find the most suspicious lateral movements in the network. This module focuses on detecting stealth actors moving through large corporate networks. With this function, CHRYSALIS will automatically train an Autoencoder, a type of deep neural network, to model the behaviors of the users in the network. Next, CHRYSALIS will compute the reconstruction error of each sub-graph in the network (lateral movements). Finally, the model will output a ranking with the most suspicious lateral movements. See next figure. Using this function is quite simple. You only need a lateral movement dataset and set a few parameters. Easy right? You do not need to be an expert in AI or ML. CHRYSALIS does it for you.
In the following table you can find the most important attributes of the find_lm_anomalies() function:
| Argument | Default value | Description |
|---|---|---|
| lm_dataset | None | Lateral movement dataset. See build_lm_dataset() function to generate the LM dataset. |
| model | None | Machine Learning algorithm to use. Supported models: [ 's2s_lstm', 'transformer' ]. |
| from_date | None | Init date for the training dataset. |
| to_date | None | End date for the training dataset. |
| top_n | 50 | The number of anomalies to detect. |
| neo4j | True | ‘True' to export the output to Neo4j format. 'False' otherwise. |
| path | '/' | Path to store the neo4j output datasets. |
Below you can find an example of the use of this function.
find_lm_anomalies(lm_dset, mode=’transformer’, from_date=’2023-01-01’, to_date=’2023-12-31’, top_n=3, neo4j=True, path=’./’)
Output:
TOP-3 Suspicious Lateral Movements in the Network
==========================================================================
1 ) Error=0.99
Date: 2023-02-09
User: user008
Lateral Movement: ['host045', 'host029', 'host021']
==========================================================================
2 ) Error=0.97
Date: 2023-02-04
User: user012
Lateral Movement: ['host012', 'host008', 'host001']
==========================================================================
3 ) Error=0.86
Date: 2023-02-06
User: user024
Lateral Movement: ['host001', 'host010', 'host011', 'host100']
==========================================================================
In addition to showing the results inline, the function saves the model's output in a CSV file. For further analysis, we could load the suspicious user activity data into any graph visualization tool such as Neo4j or Networkx. Visit our Graphs for DFIR Analysis. The Roadmap post to learn how to use graph tools in your forensic investigation.
More examples and real use cases of the new CHRYSALIS functions are available in the demos presented at the RSA conference 2023 by Jess Garcia in the talk Hunting Stealth Adversaries with Graphs & AI.
If you are not familiar with what the DS4N6 Library is or how it can help you, please check the blog post What is the DS4N6 Library (ds4n6_lib)? In the blog, you will find several articles and hands-on examples to use the power of DS and AI in your forensic investigations.
May the ds4n6 be with you!