Graphs for DFIR Analysis. The Roadmap

A growing body of research communities and businesses are demonstrating the effectiveness of using graphs for Incident Response and Threat Intelligence [1]. John Lambert, Microsoft security leader, posited <Defenders think in lists. Attackers think in graphs>. Top companies like Google, Twitter, and Cisco are incorporating graph technologies to analyze large volumes of data with interrelated attributes to be prepared against cyber-attacks [2]. The fact is that graphs can organize and represent DFIR artifacts such as network traffic or system events; thus, graph modeling is a powerful tool for Thread Hunting and Incident Response operations. Graph analysis enables agile access to data and the ability to pivot between different source types, reducing response times.
Advantages of using Graphs in DFIR:
- Get a holistic view of the network
- Understand the structure of a cyber attack
- Detect anomalies at scale
- Learn suspicious access paths (Lateral Movements)
In the landscape, there are several open-source and proprietary graph tools to store and process graph data such as Neo4j, TigerGraph, Networkx, InfiniteGraph or Titan. By using these tools together with DFIR data, analysts find a powerful weapon to perform their investigations.
How to merge both fields (DFIR and Graphs) and not die trying?
Most of the time, forensic artifacts come from multiple data sources and formats. Hence, loading DFIR data into the graph tools can be difficult, as artifacts need a pre-processing phase that can be complex and time-consuming. Fortunately, tools like Sabonis created by Toño Garcia make this task easier. Sabonis is able to extract and merge lateral movements from several forensic artifacts like EVTX or PCAP files. The tool gathers the events in a CSV file, bringing the chance to upload the data into a Neo4j graph database for further analysis. Some examples are here.
On the other hand, tools like UserLine created by Chema Garcia automate the creation of logon datasets from MS Windows Security Events. UserLine is able to show the graphical relation among users, source and destination logons, and session duration. In addition, the tool can output a wide variety of data formats for advanced analysis. Some of them are CSV, JSON, Neo4j, or Timesketch.
Graph Tools
Neo4j
Neo4j is a graph database that enables an efficient visualization and processing of graph data, as well as the execution of several graph algorithms. Neo4j provides an intuitive query language similar to SQL called CYPHER that allows you to make easy queries to the graph database. Below you can find some useful Cypher queries to start your DFIR analysis in Neo4j.
The first step will be to create your graph database. To do this, you can use any of the tools discussed above or upload your data in one of Neo4j's supported formats. Bellow there is an example of one of the most widespread formats, a CSV (comma-separated values). In the example, the CSV file contains four rows: date, src_hostname, dst_hostname, and remote_user. With the command “MERGE”, we create all nodes/hosts of the dataset (avoiding duplicates). Then, with the “CREATE” function, we establish the links between the nodes. Each link is associated with two attributes, user and date.
-- Create a graph database from a CSV file
LOAD CSV WITH HEADERS FROM "file:///graph.csv" AS evtx
MERGE (src:Host {id: evtx.src_hostname})
MERGE (dst:Host {id: evtx.dst_hostname})
CREATE (src)-[l:Link {USER: evtx.remote_user, DATE: evtx.date}]→(dst)
Once we have created the graph database, it is time for querying. You can ask for a particular user activity, node connections, or filter by time. In the following example, we are requesting all the activities of the user03 after 01/01/2023.
-- Filter activity by user and date
MATCH (src:Host)-[l:Link {USER:'user03'}]->(dst:Host)
WHERE l.date > datetime({YEAR: 2023, MONTH: 1, DAY: 1})
RETURN src, link, dst
Since one of our main goals is to find anomalies in the network, may be especially useful to know which nodes in the network have more than N outgoing links. Thus, we could detect, e.g., unusual activity between servers.
-- Query nodes with more than 10 links to other nodes
MATCH (src:Host)-[l:Link]->(dst:Host)
WITH src, COUNT(dst) AS rels, collect(dst) AS links
WHERE rels > 10
RETURN src, links, rels
Networkx
If you have basic development skills, Networkx is a fantastic Python framework to structure, study and manipulate graph datasets. You can use Networkx and famous Pandas library to query your DFIR dataset and plot the results in a graph. Below are some examples to get started with your investigations. You can find more information at the official Networkx documentation.
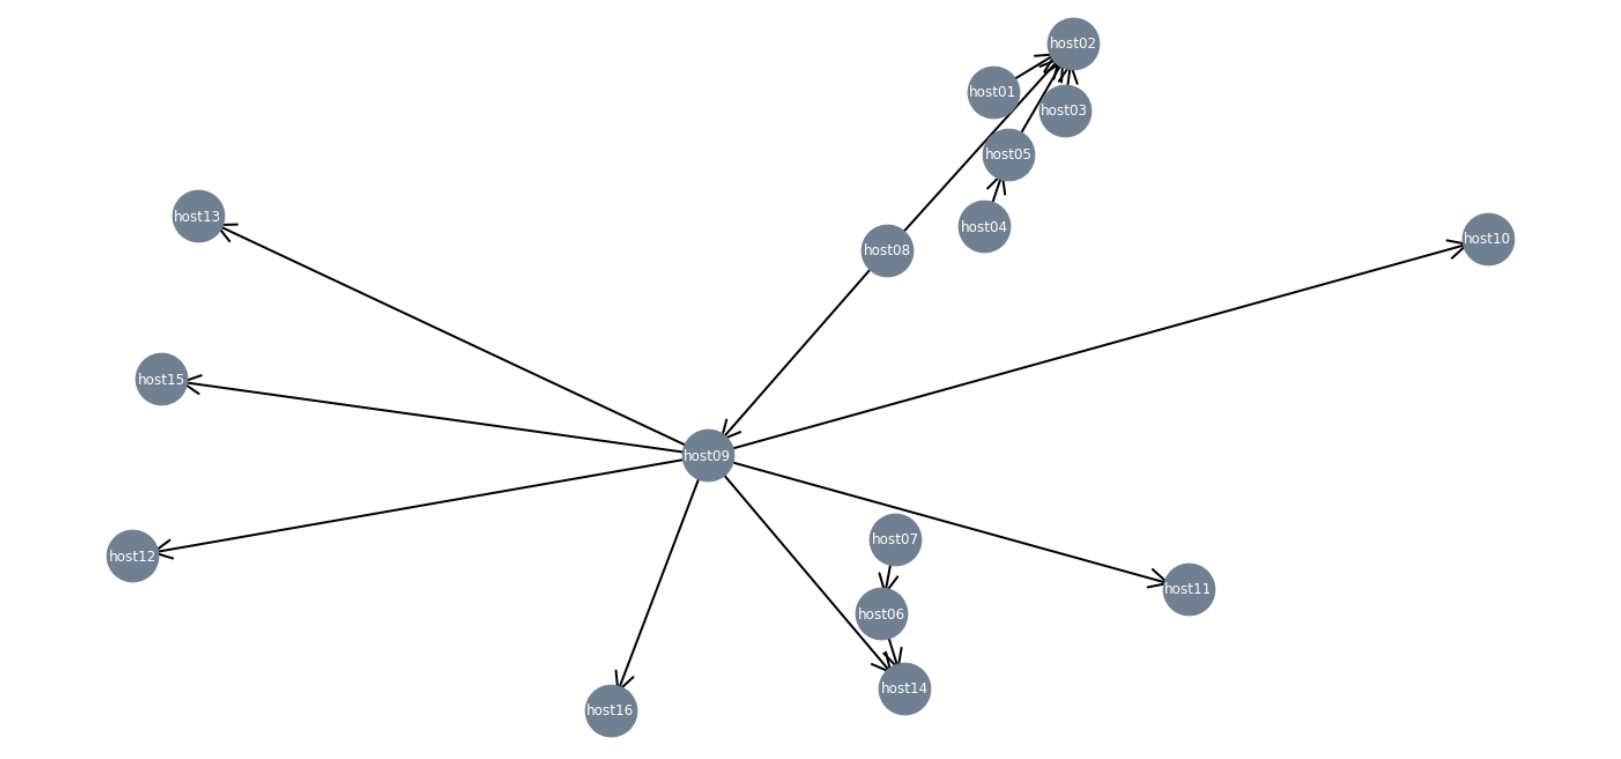
As with any other graph tool, the first step is to load the dataset. In the following example, we use Pandas to load a CSV file into a dataframe. Then, we use the function “from_pandas_edgelist()” from Networkx to build the graph. Finally, we plot the results. Note that most lines of code are for formatting the figure.
#!/usr/bin/python3
import pandas as pd
import networkx as nx
import matplotlib.pyplot as plt

dset = "graph.csv"
df   = pd.read_csv(dset)

# Build the graph
G   = nx.from_pandas_edgelist(df, source = 'src_hostname', target = 'dst_hostname', edge_attr='remote_user', create_using=nx.DiGraph())
w   = [(0,0,0,1)]*len(df)  # Default node colors
pos = nx.spring_layout(G, seed=77777)


fig    = plt.figure(1, figsize=(20, 10))
nodes  = nx.draw_networkx_nodes(G, pos, node_size=2000, node_color="slategray")
edges  = nx.draw_networkx_edges(G, pos, width=2.0, node_size=1000, arrowstyle="->", arrowsize=40, edge_color=w)
labels = nx.draw_networkx_labels(G, pos, font_size=12, font_color="white")

plt.tight_layout()
plt.show()
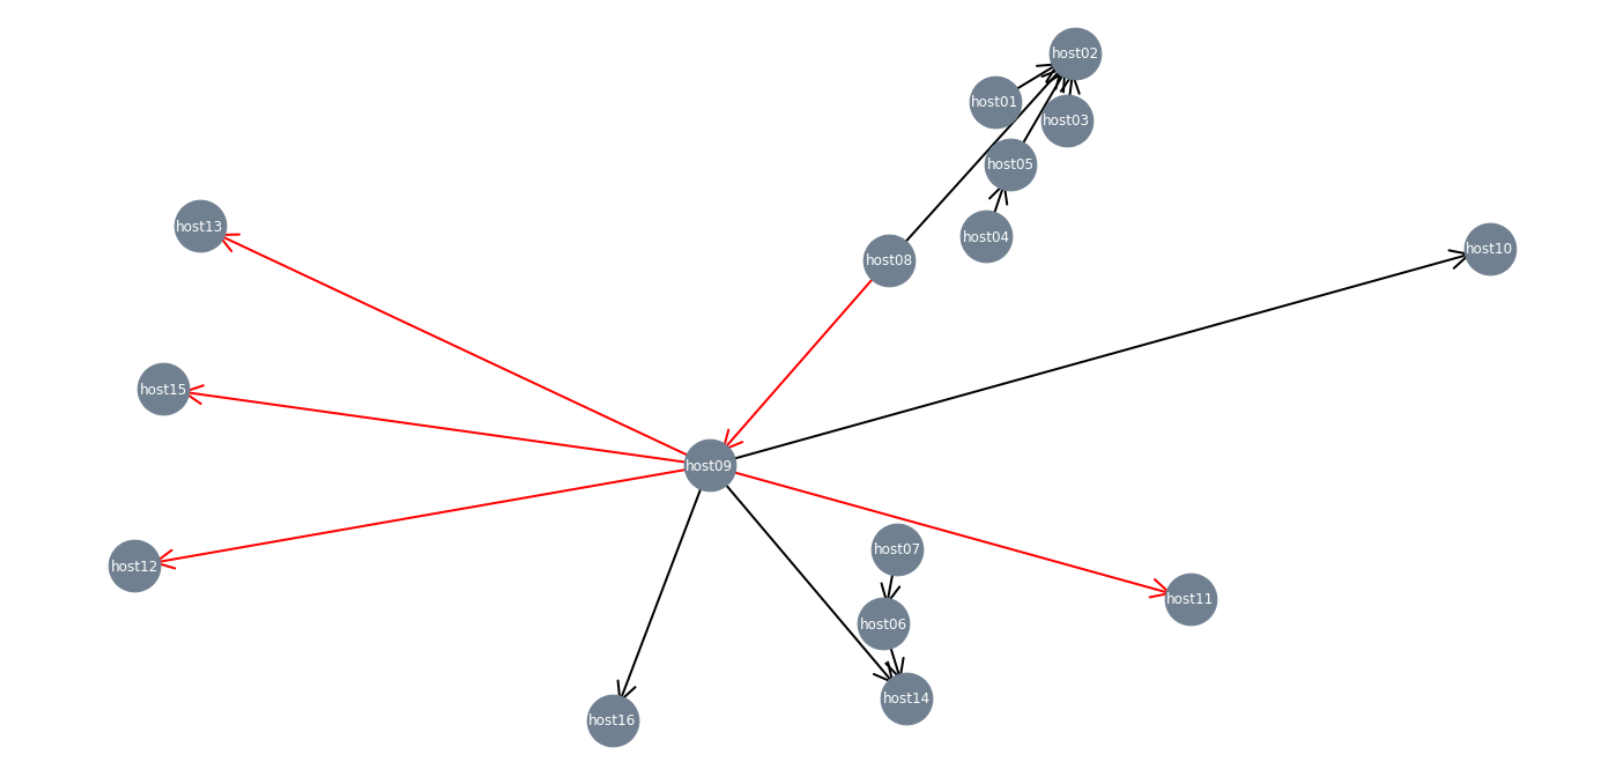
Although these tools require some programming knowledge, development environments have certain advantages. In these cases, we are not limited to the functionalities of a specific tool. In Python, we can use the library Pandas to make queries as we did with Neo4j. Below, you can find an example where we are filtering and highlighting the behavior of a particular user in the network.
#!/usr/bin/python3
import pandas as pd
import networkx as nx
import matplotlib.pyplot as plt

dset = "graph.csv"
df  = pd.read_csv(dset)
df.query("remote_user=='user03'")  # Filter 'user03' activity with Pandas

# Build the graph
G   = nx.from_pandas_edgelist(df, source = 'src_hostname', target = 'dst_hostname', edge_attr='remote_user', create_using=nx.DiGraph())
w   = [(0,0,0,1)]*len(df)  # Default node colors
usr = list(nx.get_edge_attributes(G, "remote_user").values())  # Get list of users
pos = nx.spring_layout(G, seed=77777)

for idx,i in enumerate(w):
    if usr[idx] == 'user03':
        w[idx] = (1,0,0,1)

fig    = plt.figure(1, figsize=(20, 10))
nodes  = nx.draw_networkx_nodes(G, pos, node_size=2000, node_color="slategray")
edges  = nx.draw_networkx_edges(G, pos, width=2.0, node_size=1000, arrowstyle="->", arrowsize=40, edge_color=w)
labels = nx.draw_networkx_labels(G, pos,font_size=12, font_color="white")

plt.tight_layout()
plt.show()
Maltego
Although different from the tools presented so far, the Maltego tool is worth mentioning. Maltego provides the capability to graphically model information from a wide range of open-source webs for data mining. The tool is used in cybersecurity investigations, threat intelligence, and fraud detection, among other applications. Maltego is a software that comes installed with the Kali Linux operating system and contains the sum of numerous useful OSINT tools.
Following Steps
If this awesome field has caught your eye, read on, There are more!
In the talk Hunting Stealth Adversaries with Graphs & AI presented by Jess Garcia in the RSAC23, you will find hands-on examples to apply the power of graphs in your forensic investigations. There, we show how to detect the Lateral Movement (LM) of a stealth actor by using graphs and Neo4j. Through the demos, you will learn how to load your forensic datasets into Neo4j and apply several tactics for detecting malicious LMs in your network. In addition, you will learn how to apply data science to graph datasets to take your forensic investigation to the next level.
Large networks typically have hundreds or thousands of nodes and generate millions of event logs. Therefore, automation becomes mandatory to offer reasonable response times to incidents. Artificial Intelligence (AI) and Machine Learning (ML) stand out here, giving us the opportunity to process large amounts of data to obtain high-value information. Our open-source project ds4n6.io provides a set of tools to bring data science to digital forensic investigation. The last release of the tool CHRYSALIS v0.8.1 implements new features for processing graph datasets with AI in a simple way. You don't need to know anything about ML modeling to use it, the tool does it for you!
You can find more information about the project here. We don't stop! Stay tuned for the latest news in blog posts.
May the ds4n6 be with you!
References
- LIU, Kai, et al. A review of knowledge graph application scenarios in cyber security. arXiv preprint arXiv:2204.04769, 2022.