[ds4n6_lib] Core Functions
| Function | Usage | Type | Description |
|---|---|---|---|
| whatis() | whatis(obj) | CLI | Identifies the forensic data type of an object (DataFrame -df- or DataFrame Collection -dfs-) |
| xread() | xread(options) | GUI | Reads tool output data (e.g. plaso output) and stores it in a df/dfs |
| xmenu() | xmenu(obj) | GUI | Used to easily select a dataframe from dfs, or a column from a df, displaying the selected data and allowing manual (Excel-like) analysis on it |
| xanalysis() | xanalysis(obj, options) | GUI | Displays a menu with the advanced analysis functions available for the data type (i.e. forensic artifact) given |
| xdisplay() | xdisplay() | GUI | Used to select the display settings for the dataframes that will be displayed (max. rows, max. columns, etc.) |
| simple() | df.simple(options) | CLI | Simplifies forensic output (df) showing only the most interesting columns for analysis. |
| xgrep() | xgrep(obj, options) | CLI | UNIX-like grep for the DataFrame world. Allows the user to search for a regular expression in a DF column or full DF |
| plaso_get_evtxdfs() | plaso_get_evtxdfs(obj,options) | CLI | Creates dictionary of events from evtx files using Plaso Dataframe dictionary and the hostname. |
| evtid_dfs_build() | evtid_dfs_build(obj) | CLI | Creates dictionary of event IDs from Security/System events DataFrame. This helps to identify events based on individual event IDs. |
whatis()
One of the most important things for us when developing ds4n6_lib is to make your life as easier as possible, and we are working on it in different ways. One of them is that you don't have to remember different functions names for different artifacts or tools, the library will do this work for you and, so you only have one function to read every different data or select a dataframe. But, how is the library doing this job? A very important part of the answer is the whatis() function.
whatis() is able to recognize the forensics artifact, tool used to parse it and the pandas data type you are using in your analysis, so you can use it when you don't know what a variable is. Let's see a couple of examples:

In the first example, we can see we are working with a pandas dataframe, evidence parsed with plaso and fs_stat (MFT) data. In the second example we are working with Windows .lnk
xread()
This function reads data from the supported tools and stores it in a dataframe or a collection of dataframes depending on the file. This description might seem simple but this function can do much more if you learn how to use all its variables. When using different tools and reading only with one function, there are different options that we can select.
The mandatory variable is:
- tool: [String] Forensic tool used to process the evidence. You can choose among autoruns, kape, kansa, plaso, mactime, macrobber and volatility. (We're working in a version in which “tool” won't be mandatory)
The optional variables are:
- notebook_file: [String] Path where the notebook file is.
- rootpath: [String] Path where the processed evidence is. If there isn't one written or the one chosen doesn't exist, the function will display a menu for you to select the file or files to be read.
- path_filter: [String] Filter path of files by a pattern.
- folder_parsing_mode: [String] Allows xread() function to read in 4 different ways: multiple hosts one per folder, single host with categories, multiple hosts one per file and generic.
- path_prefix: [String] Remove path from files by a pattern.
- pluginisdfname: [String] Name of the plugin you want to use.
- windows: [True or False] Delete useless columns from windows.
- usepickle: [True or False] Save or read directly from a pickle.
- encoding: [String] Choose encoding depending on the tool used.
- maxdepth: [Integer] Maximum depth in nested folders.
- prefix: [String] Specify prefix filename to be removed.
- ext: [String] Specify the extension to read
- separator: [String] csv separator.
- drop_non_ham_columns: [True or False] Drop columns which aren't in HAM format.
- get_hostname_from_folder: [String] [True or False]
- suffix: [String] Specify suffix filename to be removed.
- merge_files: [True or False] Merge all files into a df if True selected or create a dataframe for file.
- build_all_df: [True or False] In case of merge_files False, create an additional dataframe with all files.
- hostname: [String] The host name that the file has.
This function will generate a pickle file (.ham.pkl) used to read the data faster for the next times. You can read more about pickles here
In this example we read a json generated with plaso passing some of the previous parameters:

To get more information about this function while you are executing notebooks, use help(xread)
xmenu()
This function is used to select a dataframe from a collection of dataframes or a column from a dataframe, displaying all the information about the selection:

In the xmenu, we will be able to display the data we have already read. This function is very powerful and cross for all the dataframes/dictionaries regardless the tool used to get the outputs from the evidence. We can pass the following parameters:
- Dictionary: if we pass a dictionary as the argument, we will be able to select a dataframe from the collection and display it
- Dataframe: if we pass a dataframe as the argument, we will be able to select, not just the dataframe, but one of the columns of the dataframe too. If we select a column, xmenu will display the different values of that column and the number of occurrences
In both cases, there are some settings you can customize with xmenu:
- Select DataFrame: there will be one dataframe per Kape artifact output. xmenu will display the information of the selected dataframe
- Select grid: this is the way we want the information to be displayed. We have three different options:
- default: default dataframe view. In this case, if we select 20 rows to be displayed, the first 10 and the last 10 rows will be showed in the dataframe
- aggrid: it will use the ag-grid plugin to display the dataframe
- qgrid: it will use the qgrid plugin to display the dataframe
- Simple output: if checked, this option will display only the relevant columns for your dataframe
- Select max_rows: rows displayed in the dataframe. With aggrid and qgrid, this will be used for pagination/scroll
Above the table with the information, you will see two different tables: hidden columns and constant columns:
- Hidden columns: columns that are created by the tool used for the parsing of the evidence and are not interesting for the analysis
- Constant columns: columns that always have the same value, so it is displayed in this table to get a smaller dataframe
If you get a dataframe that is interesting for further analysis, you can click in the export button you have below the table. It will export the displayed dataframe to the d4.out variable
xanalysis()

This function, as xmenu(), is a powerful and cross function for all the dataframes regardless where they come from. It is a smart function that will know the type of the data you are passing as an argument (dictionary, dataframe, etc.), so you don't have to worry about the analysis types: it will display only the available ones for the input you are giving as a parameter. We are working in several analysis for all the different data, but if the xanalysis() is empty, it means there are not any analysis prepared for that type of data at this moment.
xdisplay() (GUI Helper)

This function allows the user to select the settings for the dataframes that will be displayed when working with the notebook. These are the options:
- display.max_rows: maximum number of rows displayed in the dataframe. Depending on the grid we select, this variable can be used in these ways:
- default grid: displaying the first and lasts rows
- qgrid: the number of displayed rows before scrolling
- aggrid: the number of rows per page
- display.min_rows: minimum number of rows displayed in the dataframe
- display.max.columns: maximum number of columns displayed in the dataframe
- display.colheader_justify: cells justification (right or left)
df.simple()
As we the forensicators know, when parsing an artifact with a forensics tool, we usually get lots of information, but not always in a useful and friendly way. This function, used with a dataframe, will give you a new dataframe with the most interesting columns for the analysis. The actions performed by this function to display the new dataframe are:
- Print aside hidden and constant columns
- Consolidate columns for a more friendly analysis
- Enrich columns with Knowledge Mapping (_K columns)
- Set data types for well-known columns (int, float…)
Let's see an example.
Dataframe without the simple function:

Dataframe with the simple function:

As we can see, the same dataframe has 24 columns (data fields) before the simple function and only 6 (the most relevant) after using it, so the analysis will be much easier with this function.
xgrep()

This function has been created for the ds4n6_lib to perform a search in a whole dataframe in the same way you would use a grep to investigate in command line. As parameters, you have to pass a dataframe and the string you want to search, and you will obtain a new dataframe with the rows matching the string. At the same time, the new dataframe will have the searched string highlighted.
In the example we are performing a search to look for the logins in the kali computer.
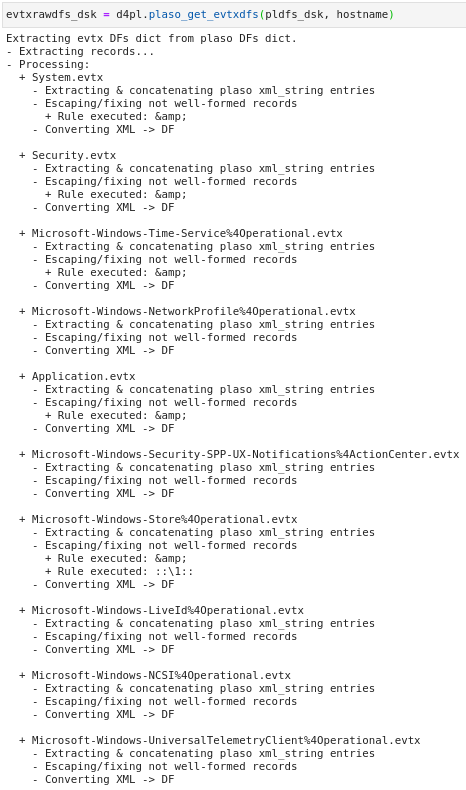
plaso_get_evtxdfs()
This function helps to parse the Microsoft’s EVTX logs from Plaso dictionary into their respective dictionary based on the hostname that the user provided. As Plaso contains all the events into the dataframe 'windows_evtx_record', extract the events from the Plaso dictionary to its own one helps forensicators to access the particular EVTX log files that they want to investigate. In this way, we are able to cut down unneccessary time to look at the unwanted events generated in the log files.
evtid_dfs_build()
This function helps forensicators to parse the Microsoft Windows Security/System event IDs to a new dictionary based on their event ID. Users can made use of this to investigate specific events using the event ID which helps to eliminate other unneccessary events generated in the evtx files. In this example, users have to pass a DataFrame that was generated from Microsoft Windows Security/System evtx files and a dictionary will be generated. In the following image, we will be using event ID 4624 (Successful logon attempts) events and use xmenu() to look at the events.
