Threat Hunting with ML - Part 5 - Detecting the Solarwinds Malicious Scheduled Task with an Autoencoder
 | [09/06/21] June 9, 2021 Jess Garcia - One eSecurity Twitter: j3ssgarcia - LinkedIn: garciajess |
[ Full blog post series available here ]

Photo by Mark Tegethoff on Unsplash
In previous parts of this blog post series we introduced our objective: trying to detect malicious activity through anomaly detection via machine learning. We also defined a specific use case: detecting the Solarwinds/Sunburst Campaign intrusion without IOCs, specifically via the detection of its malicious scheduled task. We then explained the forensic artifacts associated with scheduled tasks activity, and to end up with, we introduced the Autoencoder, a neural network architecture which is very effective at detecting anomalies.
In this post we will put everything together in the context of our Threat Hunting process: we will apply an Autoencoder to a set of real world Scheduled Tasks artifacts (from some 100 production servers), and we will see how effective the Autoencoder is in detecting the malicious Solarwinds/Sunburst malicious scheduled task. We will also apply the traditional methodology used in traditional forensic analysis, pivoting between different artifacts, to improve our anomaly detection capabilities.
Detecting the Solarwinds/Sunburst Campaign Malicious Scheduled Task
We will start simple, by just trying to detect the Solarwinds/Sunburst malicious task individually via the analysis of 2 of the corresponding forensic artifacts:
- The Scheduled Tasks event logs in the Microsoft-Windows-TaskScheduler%4Operational.evtx file.
- The file system metadata of the Scheduled Tasks XML files under C:\Windows\System32\config, obtained via the $MFT.
We will choose these two artifacts because they are relatively easy to collect as we explained in part 3 of this blog post series.
In part 2 of this blog post series we described the artifacts associated to Scheduled Tasks activity, and we also introduced the malicious Solarwinds/Sunburst task:
| Task Name | \Microsoft\Windows\SoftwareProtectionPlatform\EventCacheManager |
|---|---|
| Task File | C:\Windows\System32\Tasks\Microsoft\Windows\SoftwareProtectionPlatform\EventCacheManager |
| File Executed | C:\Windows\SoftwareDistribution\EventCacheManager.exe |
| Task User | SYSTEM |
| Task Schedule Type | ONSTART (The task runs every time the system starts). |
With the help of ADAM, our ADversAry eMulator (a DS4N6 tool that allows us to inject a sequence of malicious events in a set of pandas dataframes corresponding to different forensic artifacts), we will “inject”:
- Event Logs: 4 event log entries in the event logs dataframe corresponding to both the creation and execution of the malicious task, in the Scheduled Tasks event logs dataframe.
- File Listing: 1 entry in the File Listing dataframe (the dataframe containing the parsed $MFT data) corresponding to the XML Scheduled Task file would have been created:
- C:\Windows\System32\Tasks\Microsoft\Windows\SoftwareProtectionPlatform\EventCacheManager
Scheduled Tasks Event Logs
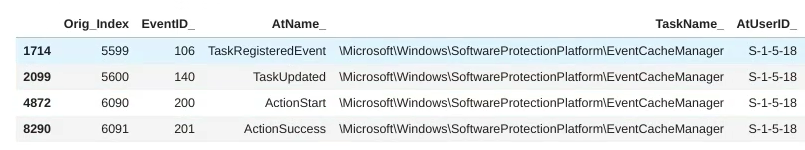
These are the 4 event log entries associated to the creation and execution of the Solawinds/Sunburst malicious task that ADAM has injected in our Scheduled Tasks event log dataframe:

Events 106/140 are associated with the creation of the task, while events 200/201 are associated with the execution of the task (that's why they appear in two different groups).
These 4 malicious events should also be anomalous events, because they will only be observed in the compromised servers (in this case in just one server), while most of the other events corresponding to standard Scheduled Tasks will be observed in most of the servers (this is the normal scheme in a normal production environment). In the real world, however, servers are not exactly the same: some servers will be running scheduled tasks that others aren't, and therefore a new scheduled task like the Solarwinds one will not be necessarily flagged as very anomalous. Depending on how different these servers are from one another in terms of existing Scheduled Tasks, that's how anomalous these 4 Solarwinds-related events will be regarded.
Let's find out!
Watch now the following short video to see how the Autoencoders classifies the 4 Solarwinds Scheduled Tasks events.
As you can see, unfortunately these 4 events are not identified by our Autoencoder as specially anomalous. They are classified as anomalies 1.714/2.099/4.872/8.290 out of 8.465 events.
Out of the 4, the best case scenario, the one which is identified as most anomalous is event 106, corresponding to the creation of the task, with an “anomaly order” of 1.714 out of 8.465 events.
In summary, the Autoencoder has not identified any of the 4 event log entries associated to the malicious Solarwinds scheduled task as specially anomalous.
Scheduled Task XML File
When a scheduled task is registered on a Windows system, an XML file is created under C:\Windows\System32\Tasks describing all the characteristics of the task (see here an example of how a file of this type looks like).
This means that when the malicious Solarwinds scheduled task was created, its corresponding file was created under that folder. In part 2 of this blog post series we showed that the path of that file was:
- C:\Windows\System32\Tasks\Microsoft\Windows\SoftwareProtectionPlatform\EventCacheManager
Our strategy in this case will be the following:
- We will generate a file listing containing the file metadata for all the files under C:\Windows\System32\Tasks (with tools like fls or MFTECmd).
- As we did in the event logs case, we will assume that similar servers will have similar scheduled tasks, and therefore similar scheduled tasks files under this folder.
- We will ignore file metadata fields that are server-specific (e.g. the MFT Entry number), and with the remaining fields we will be doing reasonable assumptions (e.g. if you schedule a file in all your servers via Group Policy, you would expect the files to be created on the same day, but at different times of the day; therefore we should ignore the time portion of the file MACB timestamps).
- Using ADAM, we will inject in the file listing an entry corresponding to the malicious scheduled task file.
- We will run the Autoencoder on the resulting file listing and we will see how anomalous that file results to be when compared with the rest of the files under C:\Windows\System32\Tasks.
This is how the injected malicious Solarwinds task would look like in the file listing:

The total number of scheduled tasks files / hostname combinations is 6.593:
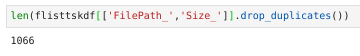
As a side note, these 6.593 file/hostname combinations correspond (if you eliminate the hostname) to 1.066 different scheduled tasks files:
It's time now to run the Autoencoder on the full file listing and find out if, this time, the file is flagged as specially anomalous!
Watch now the following short video to see how the Autoencoder classifies the malicious Solarwinds scheduled task file.
Once again, unfortunately the XML file associated to the creation of the malicious scheduled task is not detected by our Autoencoder as specially anomalous. It is classified as anomaly 1.842 out of 6.593 events.

Results Overview
Well, it looks like neither the event logs associated to the malicious Scheduled Task, nor the metadata of the corresponding file in the file system are anomalous enough to be in our Top 100.
You may remember that, in part 2 of our blog post series, we established as a hypothesis that our Threat Hunting Team would be able to detect a malicious event if it fell in the Top 100 anomalies list.
So, in summary, our Threat Hunting Team would have not been able to detect the Solarwinds/Sunburst Campaign with this methodology.
Is there a way to improve our results? Well, there actually is… keep reading!
Artifact Pivoting: Event Logs > File Listing
In the real world, when a forensicator needs to verify if a suspicious piece of evidence (e.g. suspicious event log) is actually malicious, she will analyze additional artifacts that may confirm or refute her hypothesis.
How does she do this? What she normally does is to pivot from a specific artifact to another related artifact by using one of the characteristics of the current artifact (timestamp, file name, registry entry, etc.). Specifically, she “filters” the second artifact data using the first artifact suspicious entries.
In the Scheduled Tasks case, what she would do is filter the “File Listing” data (the “body” file generated with fls, MFTECmd, etc.) using the specific tasks associated to the suspicious event log entries.
In our Solarwinds/Sunburst Campaign case, what she would do is filtering the “File Listing” data with the suspicious Scheduled Task name (EventCacheManager). Something like:
$ grep "EventCacheManager" file_listing.csv
0|C:\Windows\System32\Tasks\Microsoft\Windows\SoftwareProtectionPlatform\EventCacheManager|4261|-rwxrwxrwx|0|0|4096|1610233200.643194437|1610233200.643194437|1610233200.643194437|1610233200.643194437|0
But of course, that implies that she knows what specific task she is looking for and, in our scenario, we really don't know what we are looking for, we just have a list of anomalous tasks sorted by anomaly degree. We will need to do some assumptions first.
Let's go back to the anomaly rating we got for the event logs in the previous analysis:
- evtx (best case scenario) → 1.714 out of 8.465 events → 1.714 / 8.465 = 0,20 → Top 20%
As you can see, our first malicious event log is in the Top 20% of anomalous events in the evtx data set.
From a procedural point of view what we can do is making an assumption: the malicious task we are looking for will be somewhere in the top 25% of the event log data. This is a reasonable assumption, since a scheduled task that has never been seen before will be somewhat anomalous. As a side note, it doesn't need to be the Top 25%, it could be a Top 10% or a Top 50%, depending on the empirical results you have obtained in the past.
Remember that we are looking here to establish a methodology that allows us to perform the Hunting process via Machine Learning, not so much to define the specific values that we will be using, which can (and will) change from case to case, from artifact to artifact and from infrastructure to infrastructure (the more similar the hosts are, the narrower the window you can define). Actually, there may be additional Machine Learning processes that can be used in order to improve the results. For instance, we can use a Machine Learning classification model to classify the systems in similar groups and then run the anomaly detection algorithm in those groups. Since those groups will be similar in behavior, we expect that malicious activity will be more anomalous than in a diversified group.
Ok, let's put ourselves to work, then. Let's see how we can implement this methodology in our case.
Filtering & Pivoting
As said, we will select the top 25% anomalous event log entries, which means:
- We originally had 8,465 unique event log entries.
- After running the Autoencoder on those log entries we got a list of 8.465 event log entries sorted by anomaly level.
- We will select the top 25% entries in that list, i.e. the 25% most anomalous log entries:
- 8.465 x 0,25 = 2.116
- Therefore we will select the Top 2.116 event log entries from the anomaly-sorted event log list previously produced by the Autoencoder.
In principle all the Scheduled Tasks that appear in the event log list (the TaskName_ field) will have a corresponding XML file in the file system under C:\Windows\System32\Tasks:
- TaskName_: \Microsoft\Windows\SoftwareProtectionPlatform\EventCacheManager → FilePath_: C:\Windows\System32\Tasks\Microsoft\Windows\SoftwareProtectionPlatform\EventCacheManager
So if we have selected 2.116 unique event log entries (which in reality are a combination of TaskName / Hostname), there should be 2.116 corresponding files in the file listing (also a combination of FilePath_ / Hostname_) which correspond to those 2.116 tasks.
However, you may have noticed that in reality there is a much smaller number than that, just 735 files:
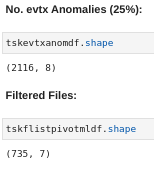
The reason for this is that the original anomaly classification had other fields into account, such as the UserName/SID, the Result Code, EventID, etc. In this case we are “collapsing” all those other fields into just two: TaskName_ and Hostname_. So multiple entries in the 2.116 task list will map to just one single file.
If you think about it we have made great progress here. Assuming that the malicious scheduled task is in that top 25% event log anomalies, we have reduced the number of potentially malicious files from 6.593 to 735! This is great, but it's still too many (remember our maximum capacity is 100).
So what we will do is run the Autoencoder again to sort those 735 files (or better, hostname/file combinations) by anomaly level.
Watch the following short video to see how the Autoencoder classifies the malicious Solarwinds scheduled tasks file after filtering the file listing with the Top 25% event log anomalies.
In this case we got the Solarwinds malicious scheduled tasks file in position 91 out of 735 (top 12%), which even when it's not an stellar result, it is good enough for us to detect the malicious task and the host in which it has been executed!

Assuming that our analysts would be investigating the Top 100 anomalies, you would have detected this intrusion!
Putting It All Together
If you take the methodology as a whole, you can see that it has actually been pretty effective.
We had a total of 6.593 scheduled tasks files in 100 hosts and we were able to identify the Solarwinds malicious scheduled task in position number 91 out of 6.593 in anomaly terms.
To summarize how this methodology works:
- You run the Autoencoder on the Scheduled Tasks Event Logs, which allows you to classify the events from the most anomalous to the least anomalous (8.465 entries).
- You select the Top 25% most anomalous scheduled tasks event log entries (2.166 entries).
- You filter the Scheduled Tasks File Listing (6.593 entries) by those Top 25% most anomalous scheduled tasks event log entries (2.166 entries).
- You obtain the filtered file list (735 entries).
- You run the Autoencoder on the filtered file list, which allows you to classify those entries (735) from the most anomalous to the least anomalous.
- Your analysts analyze the Top 100 anomalies in that list.
- Your analysts detect the Solarwinds malicious task!
You can see the whole process in a single merged video.
Hope you enjoyed this post. Stay Tuned and contact us if you have any comment or question!
[ Full blog post series available here ]
Follow us: Twitter: @ds4n6_io - RSS News Feed - Youtube